Filter particle analysis results, visualize particles
This example demonstrates use of Python commands to filter particle analysis results. After filtering, the remaining particles are filled with another color.
The example also makes another visualization of the particles drawn as ellipsoids. Similar drawellipsoids function call can be used to draw, e.g., bounding spheres of the particles, too.
The image of the particles is generated similarly to the particle analysis example.
def fill_particles():
        """
        Demonstrates analysis and filling of particles.
        """

        # Generate particle image
        generate_particles()


        # Read generated data file
        img = pi.read(output_file('particles'))

        # Analyze particles
        analyzers = 'volume coordinates pca'
        result = pi.newimage(ImageDataType.FLOAT32)
        pi.analyzeparticles(img, result, analyzers)

        # Get result data from the pi2 system
        pa = result.get_data()

        # Volume is in the first column (see the output of the 'headers' command)
        volume = pa[:, 0]

        print(f"Before filtering the shape of the results matrix is {pa.shape}")

        # Filter the measurement results using suitable Python methods.
        # Here we take only the largest particles
        limit = 20000
        pa = pa[volume > limit, :]

        print(f"After filtering the shape of the results matrix is {pa.shape}")

        # We could use set_data(...) function to push the filtered results
        # back to pi2, but we may as well use the NumPy array pa directly
        # in pi2 commands.
        #result.set_data(pa)

        # Fill the particles that we left into the pa array (i.e. the big ones)
        # Note that (for simple distributed processing support) the fillparticles
        # sets all non-filled particles to 1.
        img = pi.read(output_file('particles'))
        pi.fillparticles(img, analyzers, pa, 2)
        # Set 1 -> 255 and 2 -> 128 so that the colors of the filled particles
        # correspond to the original colors.
        pi.replace(img, 1, 255)
        pi.replace(img, 2, 128)
        pi.writeraw(img, output_file('particles_large_colored'))


        # Make another visualization by drawing an ellipsoid approximation of each particle
        # on top of the particles
        ellipsoid_vis = pi.read(output_file('particles'))

        # This draws the particles as ellipsoids whose volume equals particle volume, with color 128
        pi.drawellipsoids(ellipsoid_vis, analyzers, result, 128, EllipsoidType.VOLUME)

        # Save the result
        pi.writeraw(ellipsoid_vis, output_file('particles_ellipsoids'))
Partial output:
Before filtering the shape of the results matrix is (1549, 4)
After filtering the shape of the results matrix is (170, 4)
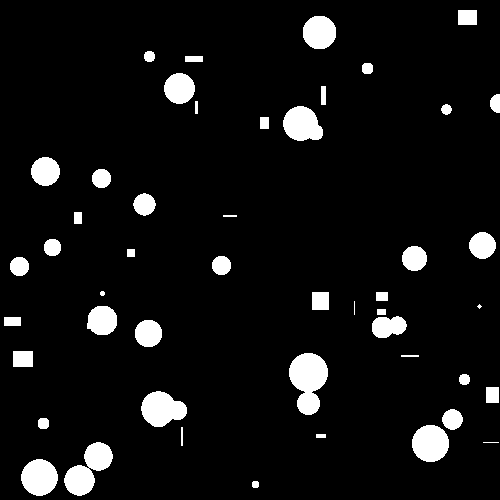
Slice of the binary input image. Background is black, particles are white.
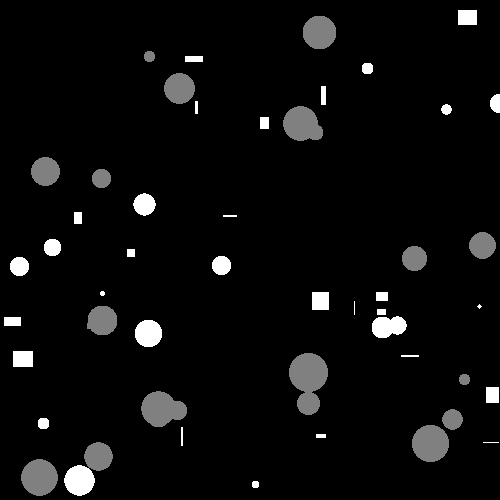
Slice of the output of fillparticles. Background is black, original particles are white, and filled particles are gray.
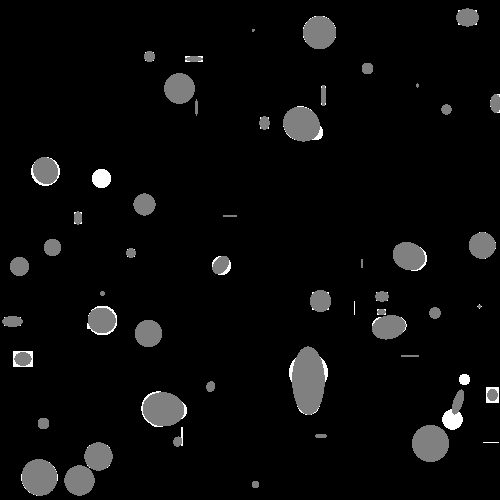
Slice of the output of drawellipsoids. Background is black, original particles are white, and ellipsoids corresponding to the particles are gray.