Histogram
This example shows how to calculate histogram of an image. In addition to the bin counts, the hist command outputs also bin starts.
In the end of the example the histogram is plotted using PyPlot.
def histogram():
        """
        Demonstrates histogram calculation.
        """

        # Read image
        img = pi.read(input_file())

        # Calculate histogram
        hist_min = 0        # Start of the first bin
        hist_max = 1000     # End of the last bin
        bin_count = 100     # Count of bins
        hist = pi.newimage(ImageDataType.FLOAT32)
        bins = pi.newimage(ImageDataType.FLOAT32)
        pi.hist(img, hist, bins, hist_min, hist_max, bin_count)


        # Get histogram data as NumPy array
        data = hist.get_data()
        bin_starts = bins.get_data()

        # Most of the background pixels are in the first bin.
        # We set it to zero so that the output image becomes nicely scaled
        # automatically.
        data[0] = 0

        # Bin edges can be generated like this if they have not been grabbed
        # from hist(...) command
        #bin_edges = np.linspace(hist_min, hist_max, bin_count + 1)

        # Convert bin starts to bin centers
        bin_size = bin_starts[1] - bin_starts[0]
        bin_centers = bin_starts + bin_size / 2


        # Plot the histogram
        import matplotlib.pyplot as plt
        plt.bar(bin_centers, data, 0.8*bin_size)
        plt.xlabel('Gray value')
        plt.ylabel('Count')
        plt.tight_layout()
        plt.show(block=False)
        plt.savefig(output_file('histogram.png'))
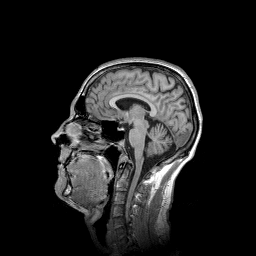
Slice of the input image.
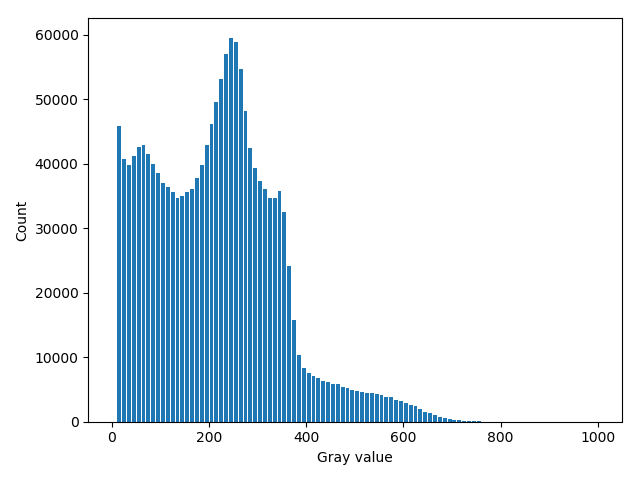
Histogram of the input image. The peak corresponding to the background has been erased.